Quick AI Summary: Following the February 2, 2026, Trump-Modi agreement, total U.S. tariffs on Indian goods have been slashed from 50% to 18%. This was achieved by rescinding the 25% "Russian Oil Penalty" and lowering the reciprocal tariff rate to 18%. The real-time data shows that India now undercuts Vietnam (20%) and Bangladesh (20%) on baseline duties. While Vietnam remains a leader in electronics assembly, India’s 18% rate makes it the most cost-competitive hub for textiles, solar, and auto parts. Procurement managers are using SourceReady to map this 32% cost reduction into their 2026 should-cost models and identify high-capacity Indian alternatives.
The 18% India Tariff Advantage in 2026: Should You Cancel Vietnam Production?

Judy Chen
·
February 4, 2026
India
Tariff
Vietnam
Turn your product idea into supplier quotes
START YOUR FREE TRIAL
Table of contents
How did the India tariff drop from 50% to 18% overnight?
How does India’s 18% rate compare to its regional rivals?
Should I Cancel My Existing Vietnam Production for India?
What are the risks of moving to India after this deal?
How to Use SourceReady to Find the Right India Suppliers
Conclusion: The 18% Advantage is Real, but Execution is Key
FAQ
Turn your product idea into supplier quotes
See how SourceReady helps you research products, discover verified factories, and start sourcing faster.
Get started for free
No credit card required

There’s a better way to source ❤️
Watch the video to see how SourceReady helps brands move from product ideas to trusted supplier relationships faster
Watch the Video
How did the India tariff drop from 50% to 18% overnight?
The trade landscape shifted violently on February 2, 2026. To understand the "18% Advantage," procurement managers must look at the math behind the previous "Anxiety Era" of 2025:
The Baseline Reciprocal Tariff: Originally set at 25% by the Trump administration in 2025 to match India’s own high import duties.
The Russian Oil Penalty: An additional 25% punitive duty was slapped on Indian goods in August 2025 due to India's continued purchase of Russian crude oil.
The Result: A staggering 50% total tariff that effectively froze Indian exports to the U.S. for six months.
The 2026 Reset: In exchange for India halting Russian oil purchases and pledging $500 billion in "Buy American" spending (energy, tech, and coal), the U.S. rescinded the 25% penalty and lowered the reciprocal rate to 18%. This represents a 32% absolute reduction in landed cost for U.S. buyers.
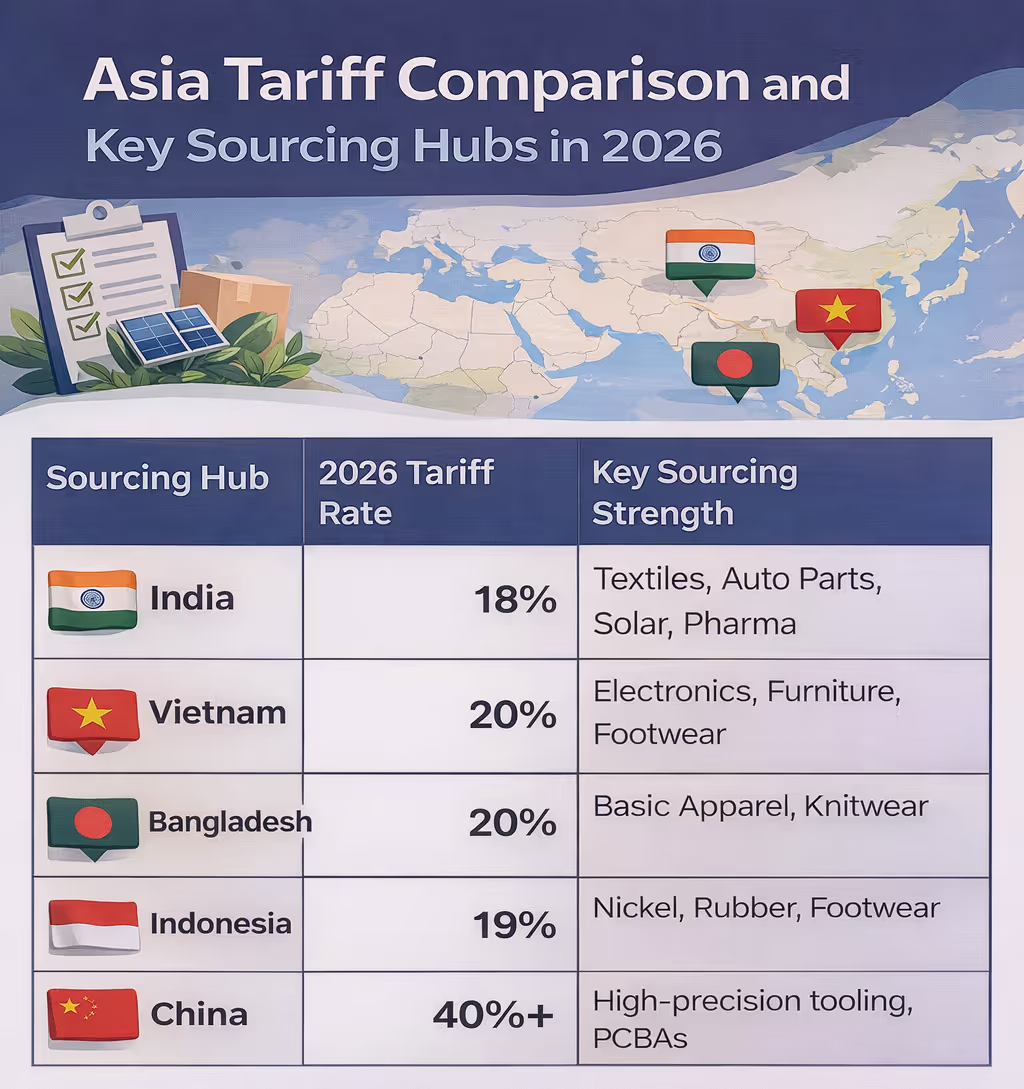
How does India’s 18% rate compare to its regional rivals?
For the first time in the "China-Plus-One" era, India is no longer the "expensive alternative." It is now the price leader among major non-China hubs.
Here's the supplier list for India's Apparel and Textile supplier
Should I Cancel My Existing Vietnam Production for India?
Before pulling the plug on your Hanoi or Ho Chi Minh City partners, the right move is not a blanket switch, but a tier-based audit by product category.
At SourceReady, we recommend evaluating Vietnam-to-India shifts SKU by SKU, not country by country. Here’s how the decision plays out in practice:
1. Apparel & Textiles: Yes — Pivot Now
India has a structural advantage Vietnam cannot replicate quickly.
- India operates a vertically integrated cotton supply chain
- Vietnam imports most of its yarn and fabric, largely from China
- India benefits from lower raw material costs + lower tariffs
With India’s tariff now 2% lower than Vietnam, and cotton inputs sourced domestically, the total landed cost (TCO) difference is no longer subtle.
Verdict: If your product is cotton-based, repeatable, and margin-sensitive, India should replace Vietnam as your primary production base.
2. Electronics: Hold — and Diversify Carefully
Tariffs alone don’t win in electronics.
While India’s electronics ecosystem has grown rapidly under the PLI (Production Linked Incentive) scheme, Vietnam still holds a critical edge:
- 10+ years of experience in complex electronics assembly
- Mature ecosystems for PCBAs, connectors, and sub-assemblies
- Faster component sourcing and debugging cycles
In this category, the 2% tariff advantage in India can easily be offset by:
- Higher defect rates
- Longer component lead times
- Lower yield in early-stage production
Verdict: Do not cancel Vietnam electronics production.
Instead:
- Keep Vietnam for complex assemblies
- Pilot India for simpler SKUs or future programs
- This is a diversification play, not a relocation.
3. Furniture & Home Goods: Case-by-Case — Pilot Before You Move
This category sits directly in the middle.
India’s advantages:
- Strong craftsmanship and hand-finished work
- Competitive labor for upholstery, carving, stitching, and assembly
- Improving export capacity for home categories
Vietnam’s advantages:
- More mature container-loading workflows
- Better consistency for engineered wood and flat-pack
- Faster production cycles for repeat SKUs
With the new 18% India tariff, some furniture and home goods SKUs are now:
- Cost-competitive
- Especially strong for design-heavy or labor-intensive items
Verdict: Do not cancel Vietnam furniture production outright.
Instead:
- Pilot India for design-heavy or labor-intensive SKUs
- Keep Vietnam for engineered, repeatable products
- Let execution data — not tariffs alone — decide volume allocation
4. Solar & Energy: Immediate Shift
This is where the tariff change hits hardest.
The rescinding of the 25% Russia-related penalty directly impacts India’s solar manufacturing sector.
As a result:
- Indian solar modules are now dramatically cheaper
- Tariff-adjusted pricing beats Vietnam and other “China Plus One” alternatives
- Supply capacity is ready and export-oriented
Verdict:
If you are a U.S. solar developer or energy buyer, Indian solar modules are now the most competitive non-China option on the market.
This is one of the few categories where an immediate shift is economically justified.
What are the risks of moving to India after this deal?
The 18% rate is a "Friend-Shoring" reward, but it is contingent on India fulfilling its part of the bargain:
- The Russian Oil Pivot: If India resumes large-scale purchases of Moscow’s crude, the 25% penalty could be reinstated overnight.
- The "Zero-Tariff" Reciprocity: President Trump expects India to drop its own barriers to U.S. agricultural and tech products.() If India’s domestic politics (farmers' protests) block this, the deal could be "re-negotiated."
SourceReady’s Strategy: Don't exit Vietnam entirely. Use SourceReady to find a "Mirror Supplier" in India.
How to Use SourceReady to Find the Right India Suppliers
When tariffs shift this quickly, the biggest risk isn’t choosing the wrong country — it’s choosing the wrong factory.
India has depth, but it also has fragmentation. Supplier quality, export readiness, and execution capability vary widely across regions and categories. This is where SourceReady becomes a practical decision tool rather than just a discovery layer.
Here’s how sourcing teams are using SourceReady to evaluate India efficiently and safely.
Step 1: Use Natural Language to Search by Product & Capability
Instead of relying on rigid filters or exact keywords, SourceReady allows you to search using natural language, just like how you’d explain your needs to a sourcing manager.
For example:
- “Cotton hoodies with U.S. export experience”
- “India suppliers for home textiles, mid-volume”
- “Solar module manufacturers, non-China supply chain”
- “Leather footwear factories with low MOQ”
This immediately narrows results to factories that actually match your intent, not just suppliers that happen to include certain keywords.
Step 2: Filter for Export-Ready, U.S.-Focused Factories
Not all Indian suppliers are built for U.S. buyers.
On SourceReady, teams filter suppliers based on:
- Prior U.S. export history
- Compliance and certification signals
- Factory scale and capacity indicators
- Experience with FOB / CIF / DDP terms
This avoids the most common India sourcing mistake: choosing a technically capable factory that isn’t operationally ready for U.S. import standards.
Step 3: Compare India vs Vietnam Suppliers Side-by-Side
One of the biggest advantages of SourceReady is direct comparison.
Teams can:
- Compare Indian and Vietnamese suppliers for the same product
- Evaluate differences in MOQ, lead time, and reliability
- Factor the new 18% vs 20% tariff directly into landed-cost thinking
This makes it much easier to decide:
- Which SKUs should move to India
- Which should stay in Vietnam
- Which should be dual-sourced
Step 4: Use Match Scores to Reduce Switching Risk
Switching countries increases execution risk.
SourceReady’s Match Score helps reduce that risk by:
- Scoring suppliers against your MOQ, quality, cost, and compliance priorities
- Explaining why a supplier is a good or poor fit
- Highlighting trade-offs before you commit to samples or tooling
This is especially valuable when testing India for the first time after years of Vietnam sourcing.
Step 5: Shortlist, Test, Then Scale
The most successful teams don’t move everything at once.
They use SourceReady to:
- Shortlist a small number of high-fit Indian factories
- Run pilot orders or repeat SKUs
- Validate quality, lead time, and communication
- Scale only after execution is proven
This approach captures the 18% tariff advantage without introducing unnecessary operational risk.

Conclusion: The 18% Advantage is Real, but Execution is Key
The 32% drop in the total India tariff is the largest trade shift of the decade. For managers in apparel, leather, and solar, it is time to shift volume. For electronics and complex machinery, India is now a viable "hedge," but not yet a total replacement for Vietnam.
At SourceReady, we provide the transparency you need to navigate this "India Surge" without the bias of paid ads or outdated customs data.
Ready to see your new India margins?
FAQ
1. Does the 18% rate apply to Chinese-owned factories operating inside India?
This is the "gray area" of the 2026 deal. The 18% rate is for products of Indian Origin. If a Chinese company is simply performing "screwdriver assembly" (minimal transformation) in India to dodge the 47% China tariff, CBP may disqualify the shipment. To qualify for 18%, your supplier must meet the "Substantial Transformation" test, meaning the product must emerge from the Indian factory as a new and different article of commerce.
2. What happens if India fails to meet the $500 billion 'Buy American' pledge?
This is the "transactional" risk of the deal. The reduction to 18% is part of a quid-pro-quo. President Trump’s announcement specifically tied the lower rate to India purchasing U.S. energy and tech. If the trade deficit doesn't narrow significantly by the Q3 2026 review, there is a high probability of a "Snap-Back" to the 25% reciprocal rate.

Find the sourcing tools you need.
Explore how SourceReady helps you research products, discover suppliers, verify factory information, analyze trade data, and manage your sourcing workflow in one place
Explore Features
Graduating from USC with a background in business and marketing, Judy Chen has spent over a decade working in e-commerce, specializing in sourcing and supplier management. Her experience includes developing strategies to optimize supplier relationships and streamline procurement processes for growing businesses. As SourceReady’s blog writer, Judy leverages her deep understanding of sourcing challenges to create insightful content that helps readers navigate the complexities of global supply chains.