Picking a winning product isn’t guesswork. It’s pattern recognition supported by clean, verifiable data. The market leaves fingerprints everywhere—search interest, import records, supplier distribution, pricing patterns, and category behavior. When you know how to read these signals, you stop relying on intuition and start making decisions that stand up to audits, investor scrutiny, and real-world manufacturing constraints.
A strong product decision doesn’t start with a factory quote. It starts with understanding whether there is actual demand, whether supply chains can support scale, and whether your margins survive freight, duties, and competition. This guide outlines the data signals that consistently separate scalable products from costly experiments.
You’ll learn how to read market demand, evaluate supply-side feasibility, and pressure-test profitability before committing to production. And yes—platforms like SourceReady, which uses AI agents to monitor Amazon, Shopify, competitor sites, and global marketplaces 24/7, make this work faster and far more accurate.
There’s a better way to source ❤️
Watch the video to see how SourceReady helps brands move from product ideas to trusted supplier relationships faster
1. Search Demand Signals: Are People Actively Looking for It?
Search demand is your first sanity check. If customers aren’t actively searching for the product, you’re trying to create demand from zero. If they’re searching at scale, you’re playing in an expanding category.
Using Google Trends in Practice
Google Trends is your baseline tool here. It doesn’t give you absolute numbers, but it shows you direction and relative interest over time.
When you test a product idea:
1. Search the core keyword (e.g. “heated blanket”).
2. Set the time range to 2–5 years to avoid overreacting to short spikes.
3. Check the curve shape:
4. Compare related keywords (e.g. “heated throw blanket”, “electric blanket
5. Review interest by region to see where demand clusters (US vs EU vs Japan etc.).
What to Track Beyond Google Trends
Layer Google Trends with other search indicators:
12–24 month search curves across platforms
Cross-platform demand (Google, TikTok, Amazon, sometimes Pinterest)
Keyword clusters that rise together
Seasonal patterns—sharp seasonal spikes are fine; random one-off spikes are not
Healthy Signal
Demand that grows steadily across multiple platforms, confirmed by Google Trends’ multi-year upward curve and predictable seasonal patterns.
2. Marketplace Data Signals: Are Customers Actually Buying It?
Search demand tells you what people want. Marketplace activity tells you what they buy—and whether they keep buying it. This is where you move from theory to commercial proof.
To evaluate real purchasing behavior, look at performance across major marketplaces, not just Amazon. Today, consumer buying is fragmented across Amazon, Shopify merchants, TikTok Shops, Temu, Walmart, and regional marketplaces. A product that performs consistently across multiple channels is far more reliable than something that only spikes on one.
Key Inputs Across Marketplaces
Amazon BSR velocity — The fastest proxy for real-time sales performance.
Tariffs (especially in US-China trade war categories)
6. Competitive Landscape Signals: Is There Still Room for You?
Competition isn’t a threat. It’s information.
Map the Landscape
Review density across top sellers
Price ladder clarity
Number of differentiated vs. “copycat” listings
Brand concentration
Good Category Characteristics
Healthy demand
Fragmented competition
Clear quality gaps
Few dominant incumbents
7. Product Complexity Signals: How Hard Is It to Produce?
A high-demand product can still fail if manufacturing is too complex.
Assess Complexity
Number of components
Specialized machinery
Precision tolerances
QC burden
Failure points
8. Regulatory Signals: Are You Entering a Compliance Minefield?
Compliance determines whether your product survives legal review—or becomes a liability.
Common Requirements
REACH/Prop65
ASTM/UL/CE
Food-contact testing
Labeling rules
Child product requirements
Healthy Signal
Compliance is straightforward and relies on standard testing rather than specialized certifications.
9. Margin Signals: Can You Actually Make Money?
A product only works if the numbers work after everything hits your P&L.
Calculate True Landed Cost
Ex-factory cost
Packaging
Freight (air/sea/parcel)
Duties/tariffs
Last-mile fees
Return rates
CAC
Target Benchmarks
4–6x retail markup
30–40% net after freight + duties
20–30% contribution margin after CAC
How SourceReady Helps
Traditional product research is slow and fragmented. You jump between Amazon pages, Shopify stores, competitor sites, Google Trends, import data tools, and supplier directories. By the time you’ve collected everything, the market has already moved.
They capture real-time signals—search activity, product launches, price changes, review velocity, category shifts—and transform them into structured insights you can actually use. No manual scraping. No tab overload. Just actionable intelligence.
What You Can Do with Product Research on SourceReady
Market Analysis
Get a clear snapshot of your target market:
Market size
Growth rate
Top buyer regions
Key subcategories
You quickly determine whether a category is worth entering—or whether you’re walking into oversupply.
Trend Insights
Stay ahead of seasonal shifts and emerging patterns:
Search term surges
Holiday-driven demand
Product life-cycle stages
Early signals from social commerce platforms
This helps you time your launches instead of chasing trends after they peak.
Price Analysis
You see how pricing behaves across:
Amazon
Shopify stores
Regional marketplaces
For every product category, you get:
Minimum price
Maximum price
Average selling price
Distribution across quality tiers
You can instantly position your pricing strategy without guesswork.
Competitor Analysis
Understand who already owns the category:
Top brands and sellers
Bestselling SKUs
Review velocity
Pricing strategies
Product differentiation patterns
You avoid saturated categories and identify openings competitors missed.
Smarter, More Local Product Research
Global markets don’t behave the same everywhere. What sells in the US might not sell in Japan or Germany.
SourceReady’s agents now analyze local signals by region or country.
How This Works
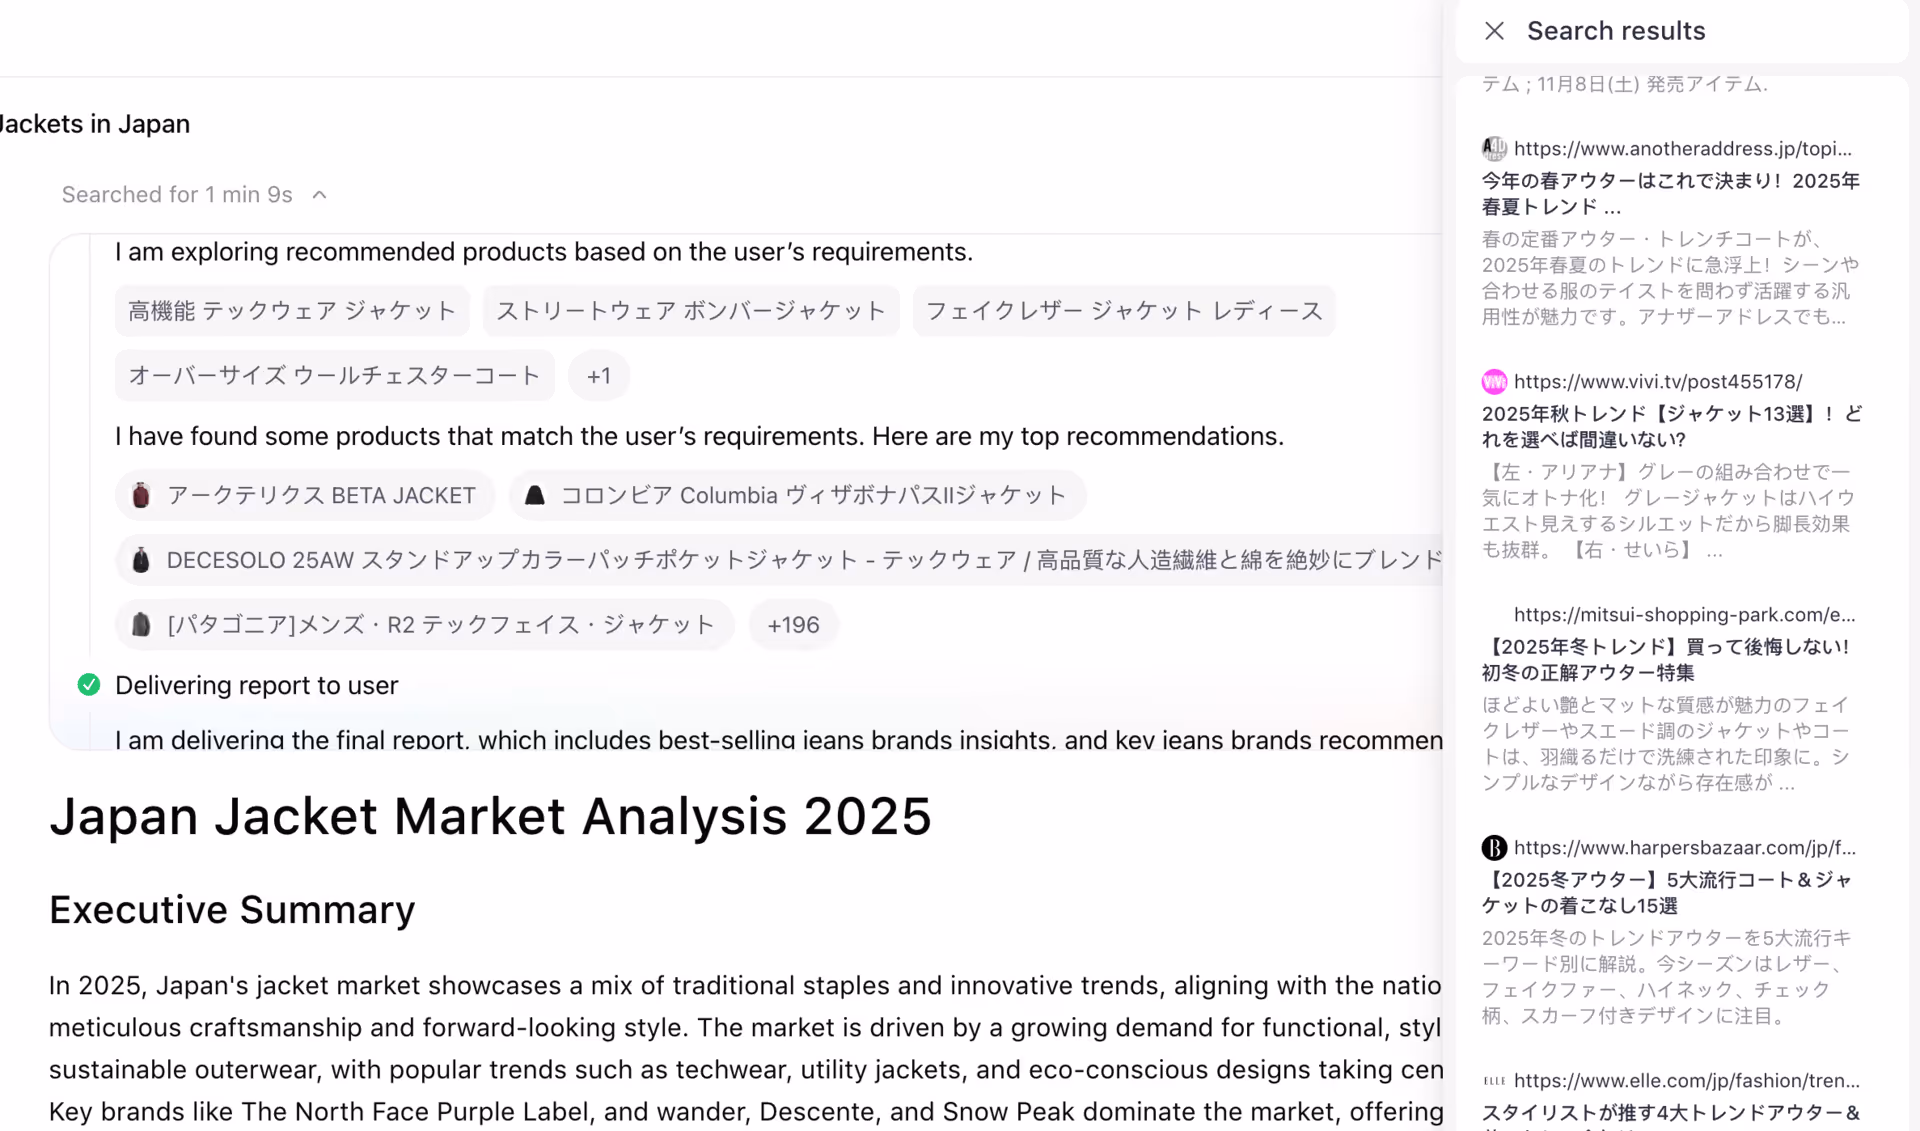
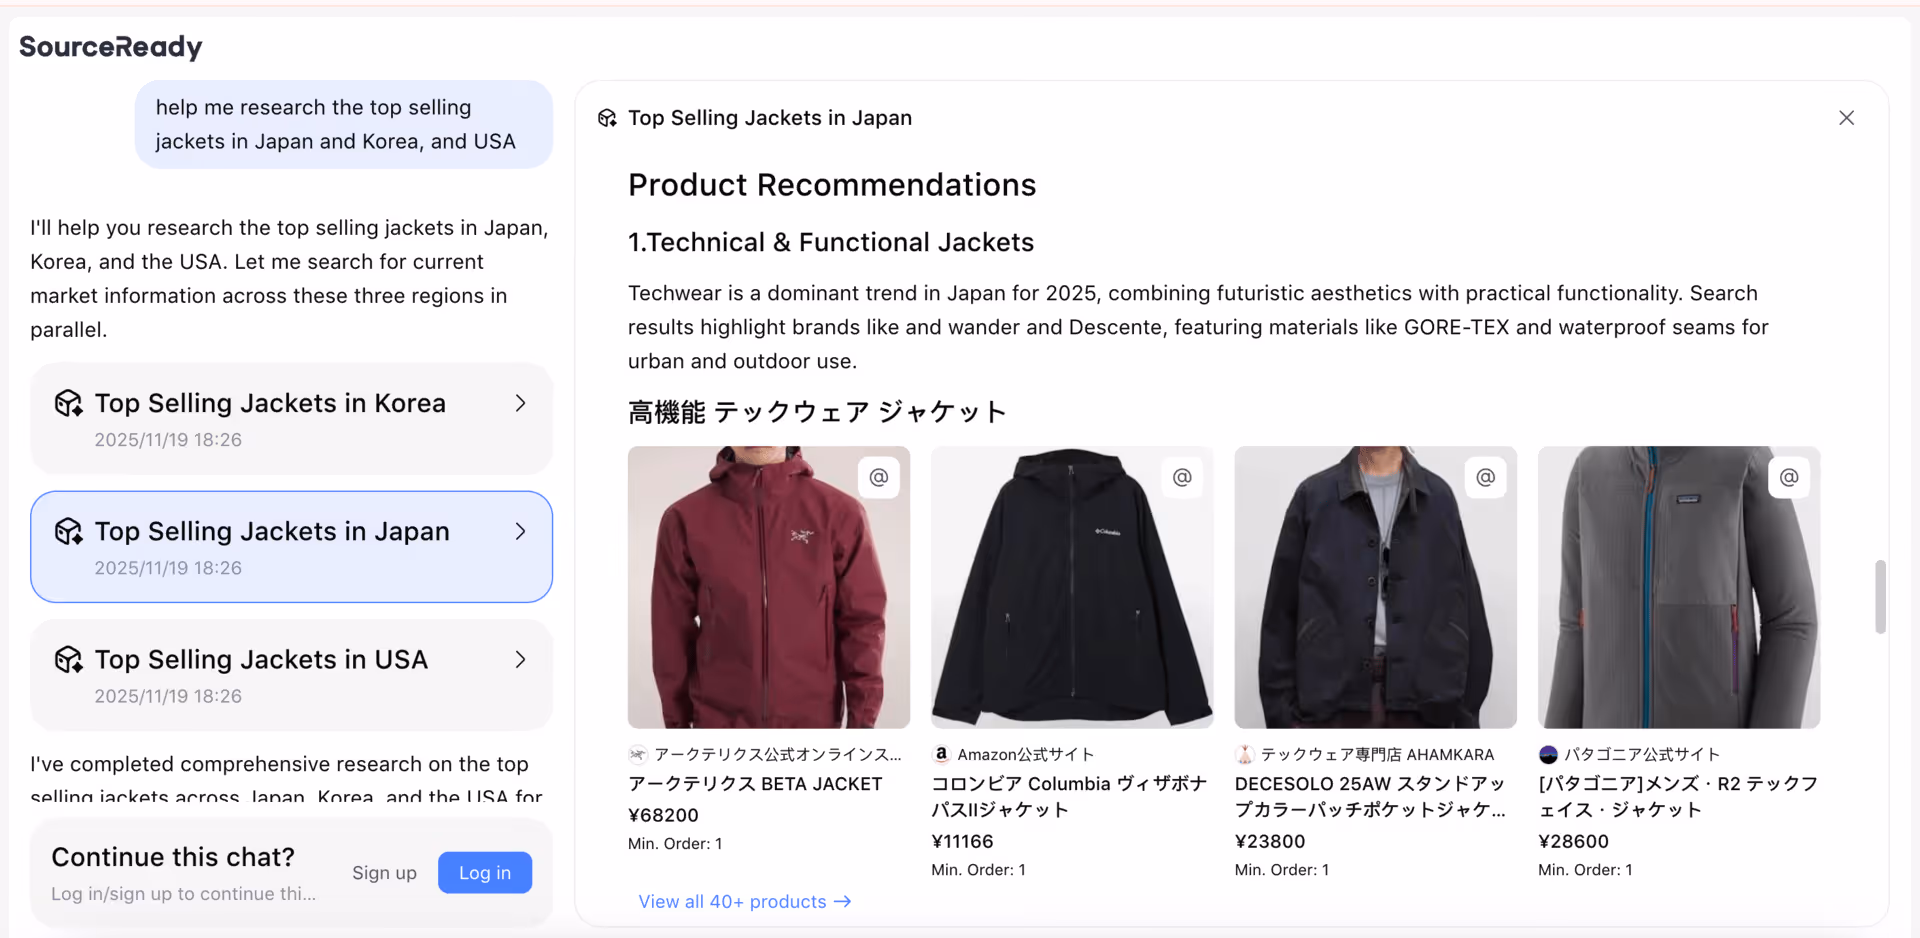
If you search:
“Top-selling jackets in Japan”
The agent automatically:
Prioritizes Japanese sites
Pulls signals from local marketplaces
Accounts for regional brands
Reflects local pricing and materials
Surfaces Japan-specific consumer patterns
You get accurate, localized market intelligence—not a generic global view.
Conclusion
Winning products aren’t random. They follow recognizable patterns—rising search interest, strong marketplace traction, stable import volume, broad supplier coverage, manageable costs, and sustainable margins. When you evaluate product ideas through structured signals rather than instinct, your decisions become repeatable, defendable, and aligned with long-term profitability.
This guide gives you a practical, audit-ready framework for that evaluation. Pair these signals with real-time intelligence from SourceReady, which monitors Amazon, Shopify, competitor sites, and marketplaces around the clock, and you gain a competitive advantage. You spend less time guessing and more time acting on hard data—whether you're exploring new categories, validating a product idea, or planning expansion into global markets.
Strong product decisions start with strong signals. Now you know exactly where to look.
FAQ
1. How do I know if a product has long-term demand, not just a trend spike?
Look at multi-year search trends, not 30-day data. Use Google Trends with a 2–5 year window. Then confirm with Amazon BSR history, TikTok Shops order velocity, and import volume. When all three signals rise consistently, the product is long-term—not a viral spike.
2. When is a category too competitive to enter?
A category is oversaturated when:
Top listings have 15,000+ reviews
Prices keep dropping
All products look identical
CPC costs are rising Enter only if you can offer clear differentiation (materials, design, features, branding).
3. How can I check if a supplier is reliable?
Look for:
Export history
Certifications and audit records
Consistent MOQ policies
Clear communication
Professional documentation (COA, test reports) Then verify with due diligence through factory videos, third-party audits, or production samples.
Find the sourcing tools you need.
Explore how SourceReady helps you research products, discover suppliers, verify factory information, analyze trade data, and manage your sourcing workflow in one place
Graduating from USC with a background in business and marketing, Judy Chen has spent over a decade working in e-commerce, specializing in sourcing and supplier management. Her experience includes developing strategies to optimize supplier relationships and streamline procurement processes for growing businesses. As SourceReady’s blog writer, Judy leverages her deep understanding of sourcing challenges to create insightful content that helps readers navigate the complexities of global supply chains.